How to Rick Roll Like a Data Scientist?
Solid-body trajectoids are 3D shapes that roll along a path you choose. I turn S&P 500 data into one, then roll out Never Gonna Give You Up.
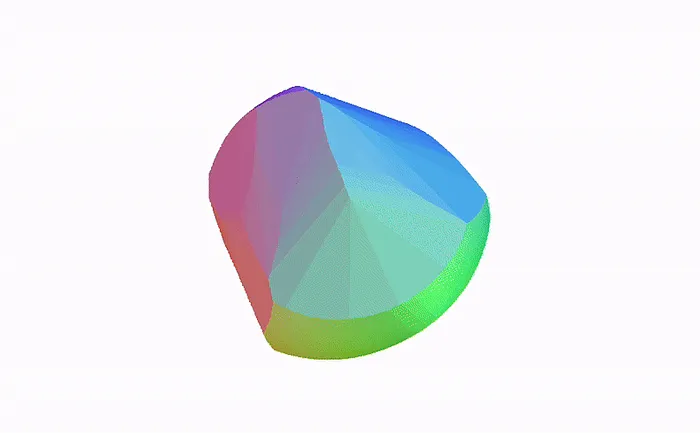
A trajectoid. Image by the Author
Rick Rolling —a legendary internet phenomenon that has transcended mere meme status and infiltrated its way into various cultural domains including, media, technology, and even politics. It began as a simple bait-and-switch prank but has evolved into a cultural symbol that represents the playful and ironic nature of the internet.
Naturally, it’s time to introduce its data-driven variant targeted at Data Scientists by leveraging a fascinating concept from computational geometry: solid body trajectoids.
In this article, we will explore trajectoids, demonstrate their application using S&P 500 data, and create the ultimate data-driven Rick Roll that can literally be rolled.
What are Trajectoids?
Solid Body Trajectoids are 3D shapes specifically programmed to follow a predetermined path when rolled. For instance, if you draw a straight line on a ramp and roll a sphere down it, the sphere will naturally roll along that straight line. What if the path is more complex? Is there a shape that, when rolled, will follow this more intricate path? Moreover, does every arbitrary path have a corresponding 3d shape that will follow it precisely when rolled?
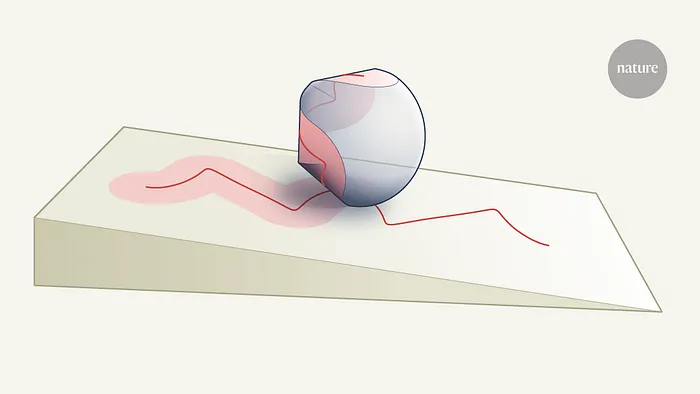
A happy trajectoid in its natural habitat rolling down a slope. Image by Nature
This exact question was explored by a team of researchers led by Professor Bartosz Grzybowski at the Institute for Basic Science in Korea and their findings reveal that these kinds of shapes exist for nearly all paths*. The researchers dubbed these shapes trajectoids and described the mathematical procedure necessary for generating such objects in Solid-body Trajectoids Shaped to Roll Along Desired Pathways paper. After publication, these findings turned out to be interesting from a geometric point of view and had far-reaching implications in quantum computing and robotics. Let’s get this ball rolling with some concrete examples to see what trajectoids actually look like!
S&P 500 Trajectoid
Let’s first explore how trajectoids work by using a familiar path as input. The S&P500 is a free-float weighted/capitalization-weighted stock market index that tracks the performance of 500 large companies listed on stock exchanges in the United States. The index often serves as a barometer for the dynamics of the U.S. economy (unrightfully) and often makes headlines for its sometimes erratic behaviour. We’ll extract the time series data from the S&P 500’s daily closing prices and generate a 3d shape that can roll along the time-series.
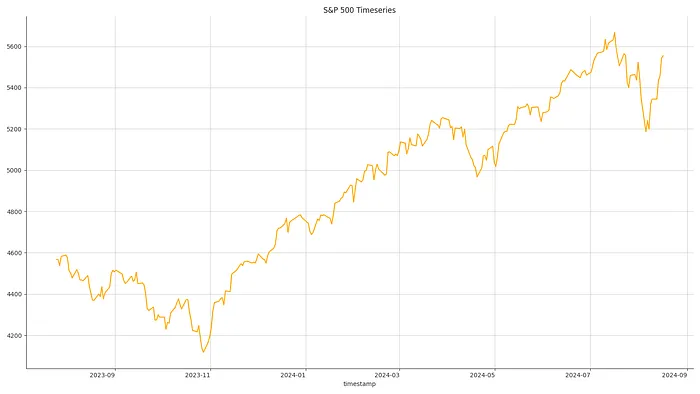
S&P500 composite index over the past year. Image by the author.
Since the daily prices tend to fluctuate quite a bit it will make the movements of the resulting trajectoid quite jerky. We can smooth out the line with a rolling average and make the rolling path of the trajectoid a little smoother (you can see the full data transformation steps in this repository) and use the processed time series to generate its trajectoid:

S&P500 2024 Trajectoid. Image by the Author.
While the shape of a trajectoid might seem arbitrary, it’s important to remember that the stock market, at its core, is the largest information-processing system created by humanity. It operates as a vast network of agents (rational or irrational, depending on your stance on the efficient market hypothesis ) constantly interacting with and reacting to an immense flow of new information. This trajectoid represents the collective responses of the U.S. stock market to information processed over the past year. The rise and fall of the S&P 500 guide the trajectoid’s rolling direction, embedding the market’s ongoing adjustments to the influx of data into its geometric shape.
Never Gonna Give You Up
Now that we’ve warmed up with some financial data, it’s time to turn Rick Astley’s “Never Gonna Give You Up” into a trajectoid. Let’s first see what the audio waveform for “Never Gonna Give You Up” looks like.
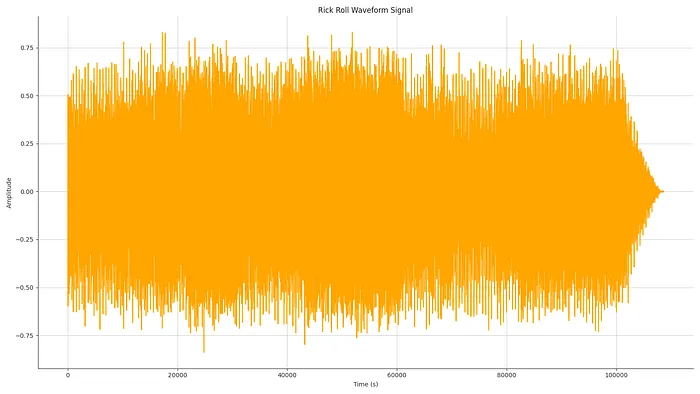
Rick Astley’s “Never Gonna Give You Up” waveform. Image by the author.
An audio waveform represents the variations in air pressure (sound) over time. It’s a direct visual representation of the song’s amplitude (volume) at each moment. Visualizing this waveform gives us an idea of the song’s structure — the peaks and valleys correspond to louder and softer parts of the track. However, while visually interesting, the raw waveform version of the audio is not ideal for creating our trajectoid. We need to simplify this data into a form that can be more easily manipulated.
To create a more usable path, we focus on the amplitude envelope of the waveform. The amplitude envelope captures the general shape of the waveform by tracking the peaks over time, giving us a smoother and more continuous path. This envelope more closely resembles a trajectory and by extracting it, we reduce the complexity of the waveform while preserving the overall shape and dynamic range of the audio.
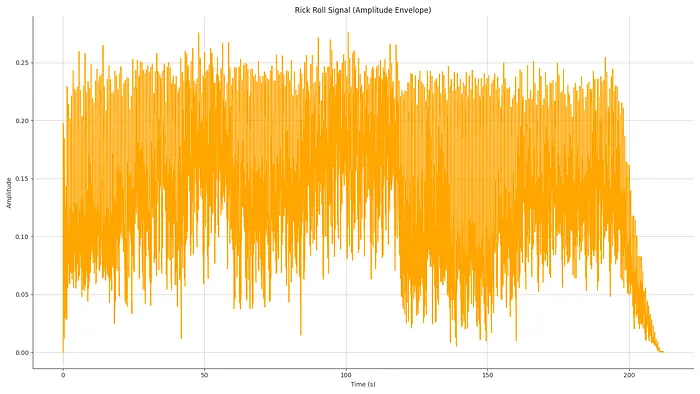
Rick Astley’s “Never Gonna Give You Up” amplitude envelope. Image by the author.
Next, we zoom in on the most recognizable part of the song: the chorus, where Rick sings “Never Gonna Give You Up.”
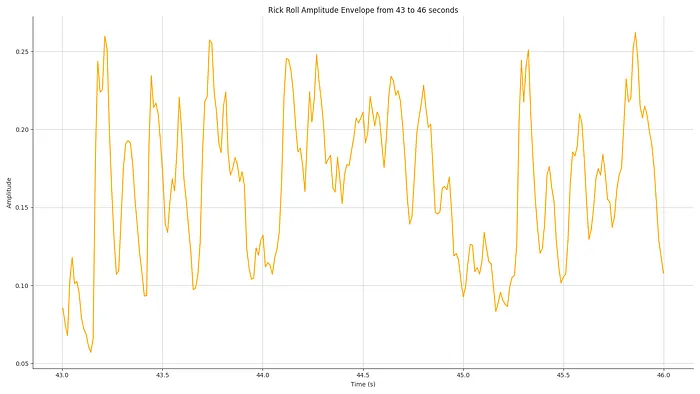
Rick Astley’s “Never Gonna Give You Up” amplitude envelope. Image by the author.
Similar to how we processed the financial data, we apply smoothing transformations to the amplitude envelope of the chorus. Smoothing helps to eliminate any remaining sharp transitions, ensuring the resulting path is suitable for trajectoid generation.

Trajectoid Generated from “Never Gonna Give You Up” segment amplitude envelope. Image by the author.
Let’s also visualize the path on the surface of the trajectoid to demonstrate the rolling better:

Trajectoid and the Path Generated from the “Never Gonna Give You Up” segment amplitude envelope. Image by the author.
When rolled on a slope, this shape will draw out a path that represents the amplitude envelope of Astley’s iconic “Never Gonna Give You Up”. Giving us the ultimate data-driven rickroll that actually rolls while rickrolling.
If you would like to 3d print the trajectoid you can find the .stl file and the full code behind the article here:
GitHub - Geometrein/trajectoids: How to Rick Roll with Trajectoids
References
Original Trajectoids Article: Yaroslav I. Sobolev, Ruoyu Dong, Tsvi Tlusty, Jean-Pierre Eckmann, Steve Granick, and Bartosz A. Grzybowski. “Solid-body trajectoids shaped to roll along desired pathways”. Nature, 620, 310–315 (2023). https://doi.org/10.1038/s41586-023-06306-y
Open Access PDF: https://www.nature.com/articles/s41586-023-06306-y.epdf
Notes:
*The time series are smoothed with a rolling average and differenced. This helps avoid situations where we need to work with large values in the range of thousands and prevents the path from being too jerky (a known problem for trajectoids)