How the CIA Used Network Science to Win Wars
In 1955 the US Air Force modelled the Soviet rail network as a flow graph to find where to cut it. The classified study that gave us max-flow min-cut.
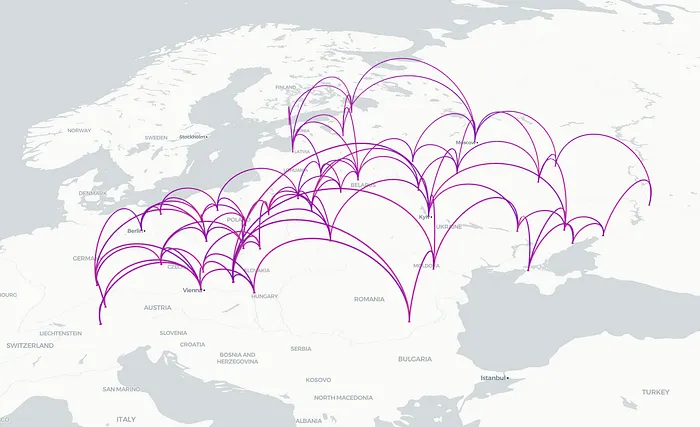
Image by the Author
The importance of logistics in modern warfare has only risen since the invention of total war during the Napoleonic era. During the First World War US Army General John J. Pershing famously noted that:
“Infantry wins battles, logistics wins wars.”
— US Army General John J. Pershing, commander of the American Expeditionary Forces on the Western Front during WWI.
This theory remained in the US Army’s arsenal even during the Cold War. After the Second World War, rail networks were a critical component of Soviet logistics, used for moving military supplies, troops, and economic goods across the vast expanse of the country. Understanding and potentially disrupting the logistics and transportation networks of the USSR was of strategic interest to the United States. Therefore, in the 1950s, the U.S. Air Force commissioned a study to determine how to effectively cut off rail infrastructure within the Soviet Union and Eastern Europe in case of a potential conflict. The study was conducted by mathematician T.E. Harris and retired U.S. Air Force General F.S. Ross. In 1955, they published a classified report titled “Fundamentals of a Method for Evaluating Rail Net Capacities” that modelled the Soviet rail infrastructure as a flow network.
In the first of its kind report authors modelled the Soviet rail network as a set of nodes and links. The nodes represent the aggregated rail infrastructure of the region, while the edges represent the connections between the transportation hubs. Each link was assigned a weight based on the estimated tonnage capacity that can be transferred from one node to the other within a day (see illustration below).
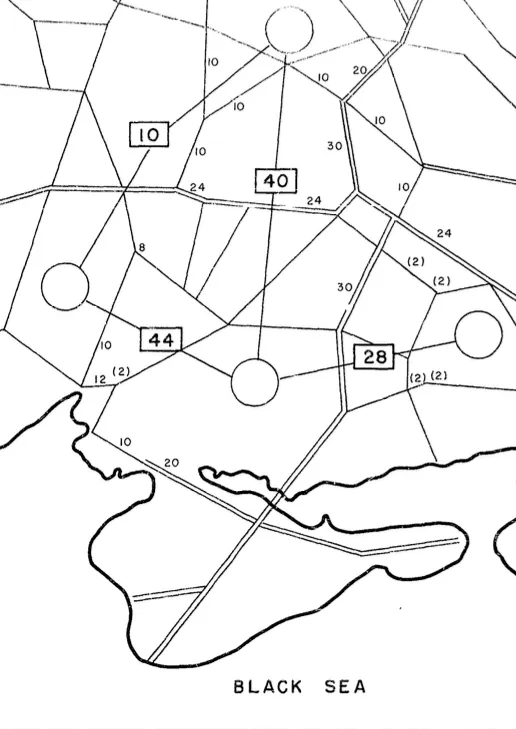
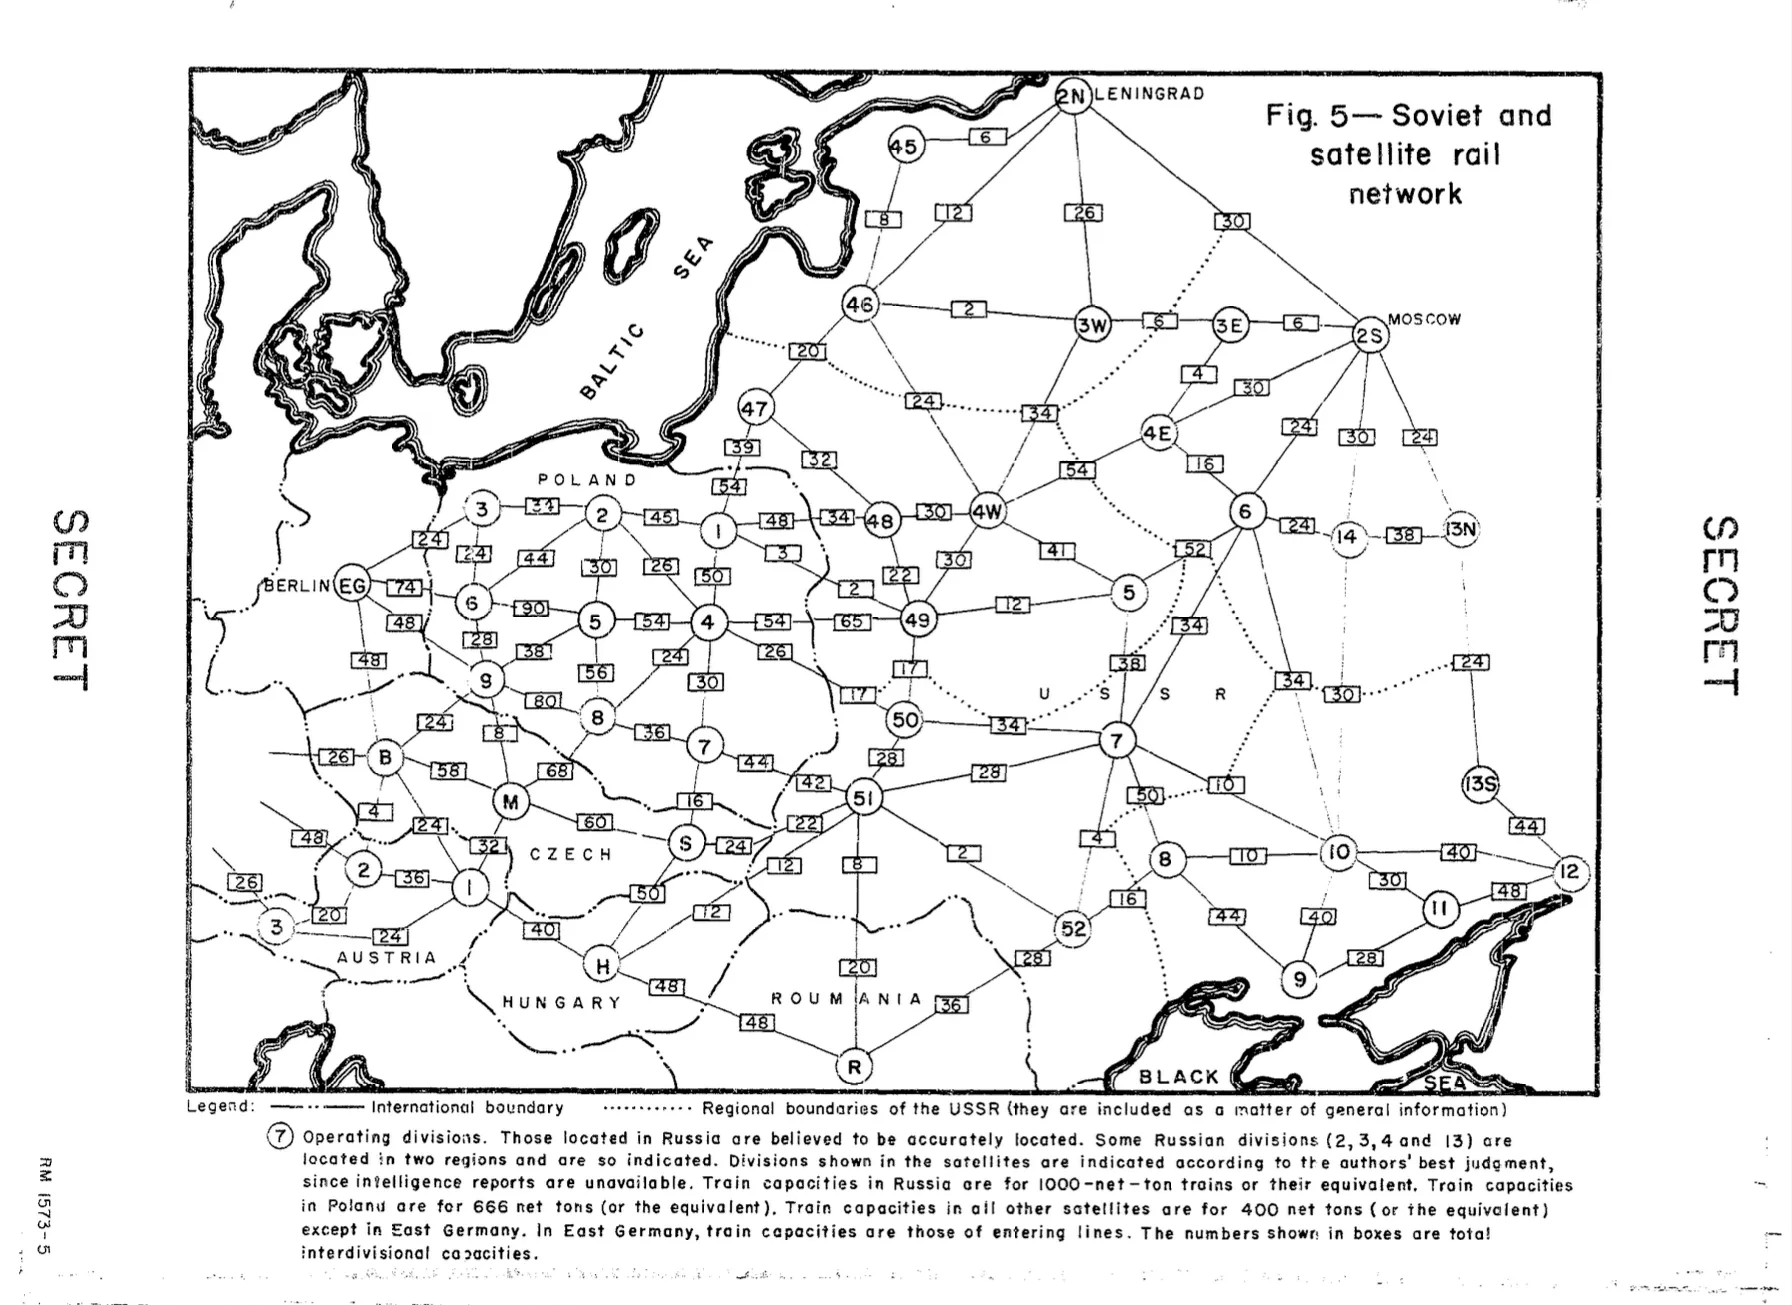
Fundamentals of a Method for Evaluating Rail Net Capacities T.E. Harris & F.S. Ross
The study’s goal was to estimate the rail network’s capacity between the nodes and determine which links were the most optimal airstrike targets to paralyse the flow of cargo.
While this might seem like a straightforward task there is a catch! In well-connected networks incapacitating two nodes or the link between them doesn’t necessarily stop the flow between the nodes. Often the flow can simply be re-routed through a neighbouring node.
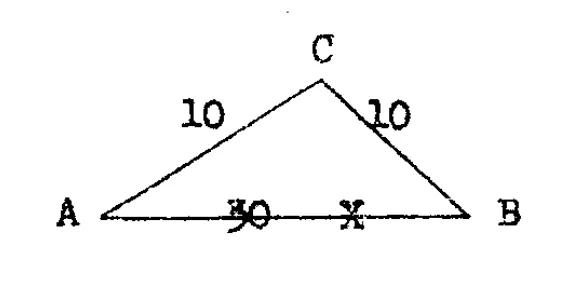
In the illustration above if the link between nodes A & B is severed the nodes will still be connected through node C and some of the cargo can still reliably reach its destination. When this principle is applied to large networks with a great number of interconnected triplets, finding the most optimal cuts becomes a compelling challenge. We can illustrate this by recreating the original Harris-Ross network of the Soviet Rail system with NetworkX and see what that means in practice.
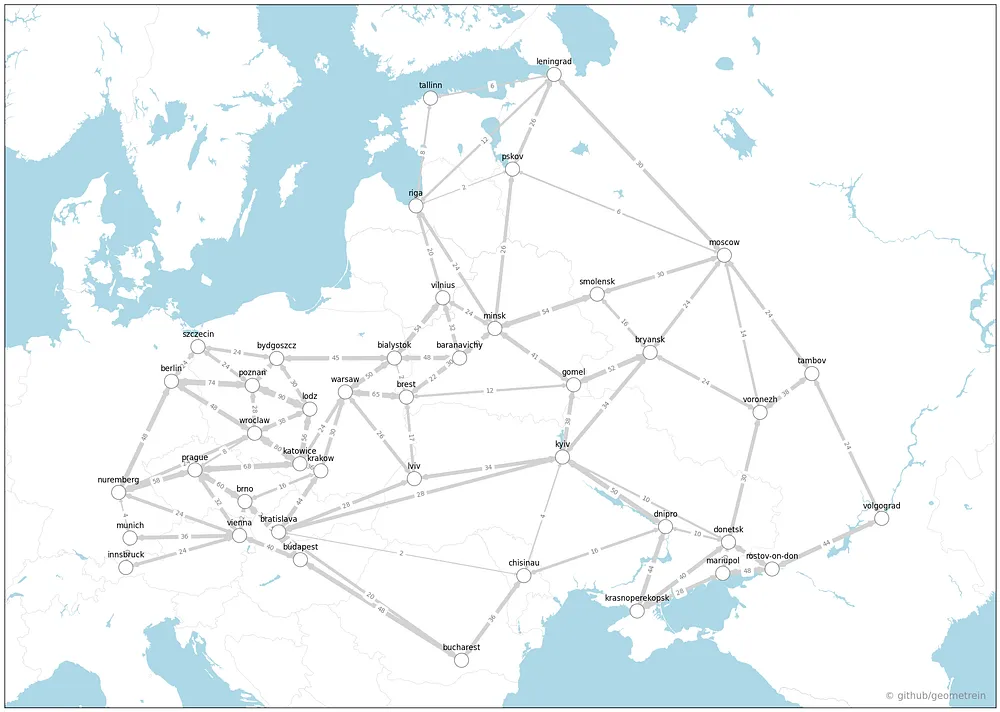
Recreated Ross Harris network. Image by the Author
The illustration above demonstrates the recreated Harris-Ross network. It is based on the network presented in the original paper and has the following properties:
Number of nodes: 42
Number of edges: 91
Average degree: 4.33
Density: 0.1057
Average clustering coefficient: 0.4364
Diameter: 8
Average shortest path length: 3.55
Which links should be removed to sever the connection between two arbitrarily selected nodes? The answer is far from obvious. There is more than one path connecting a pair of nodes hence the excess load created by a missing link can be distributed onto existing links without an issue. We can illustrate this with a more traditional approach and try to remove the most important links/nodes from the network and see how that affects the network’s connectivity. We can simulate hypothetical air strikes on the network and check how the size of the giant component in the network changes after each strike removes the important nodes and links.
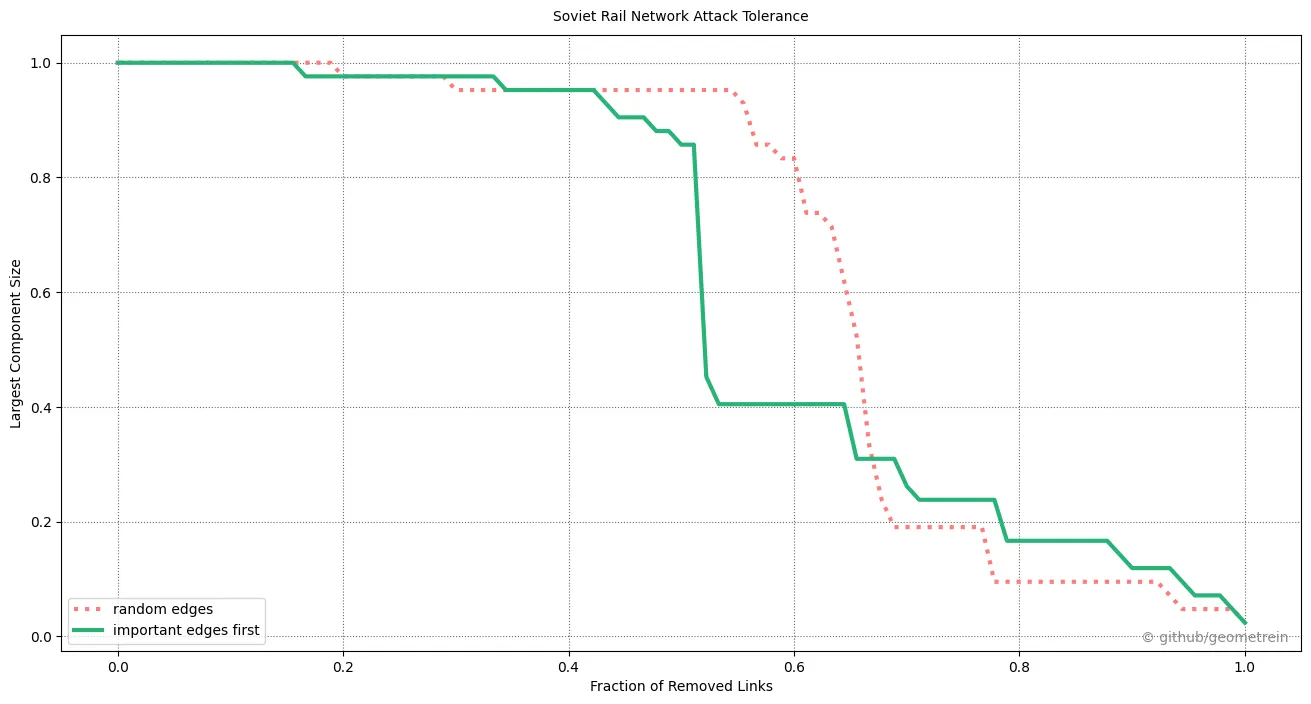
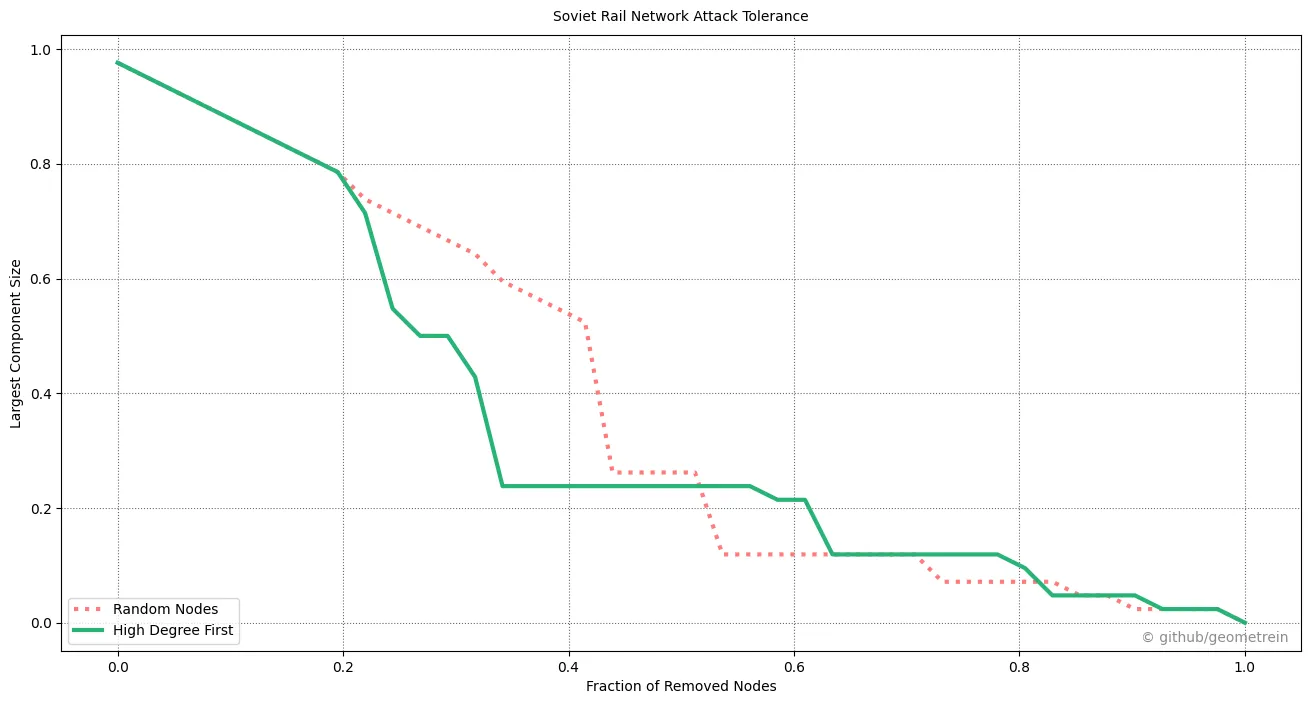
Image by the Author.
The charts above illustrate how the network will disintegrate after each hypothetical air strike disables a link/node. The speed of the network’s disintegration is compared to the removal of random links/nodes so there is a benchmark to compare the strategy against. As we can see in the case of Harris and Ross network removing the most important nodes or edges has a comparable effect on the integrity of the graph as removing random nodes and edges. Networks in both cases disintegrate at a similar phase. This illustrates that for this network targeting large railway depots or links that have the most capacity doesn’t necessarily result in better outcomes than playing a military whack-a-mole and removing random depots and links.
Max-Flow Min-Cut theorem
To address this limitation, Harris and Ross in cooperation with Dantzig and Fulkerson developed a theoretical and practical method that today is known as the Max-Flow Min-Cut theorem. The theorem states that in a flow network, the maximum amount of flow that can be sent from the source node to the target node is equal to the total weight of the edges in the smallest cut that separates the source and target.
An easy way to conceptualize the idea behind the theorem is to imagine a system of pipes carrying water from a reservoir (source node) to a tank (sink node). Each pipe has a certain capacity for water flow. The Max Flow Min Cut Theorem states that the maximum water flow you can achieve (max flow) is exactly equal to the total capacity of the narrowest points you need to block to stop all water from getting to the tank (min cut).
We can apply Max-Flow & Min-Cut algorithms to analyse the network capacity between two nodes and determine the most optimal airstrike links for a set of nodes. The graphs below illustrate the optimal airstrike targets for Kyiv-Berlin and Moscow-Donetsk target-sink pairs:
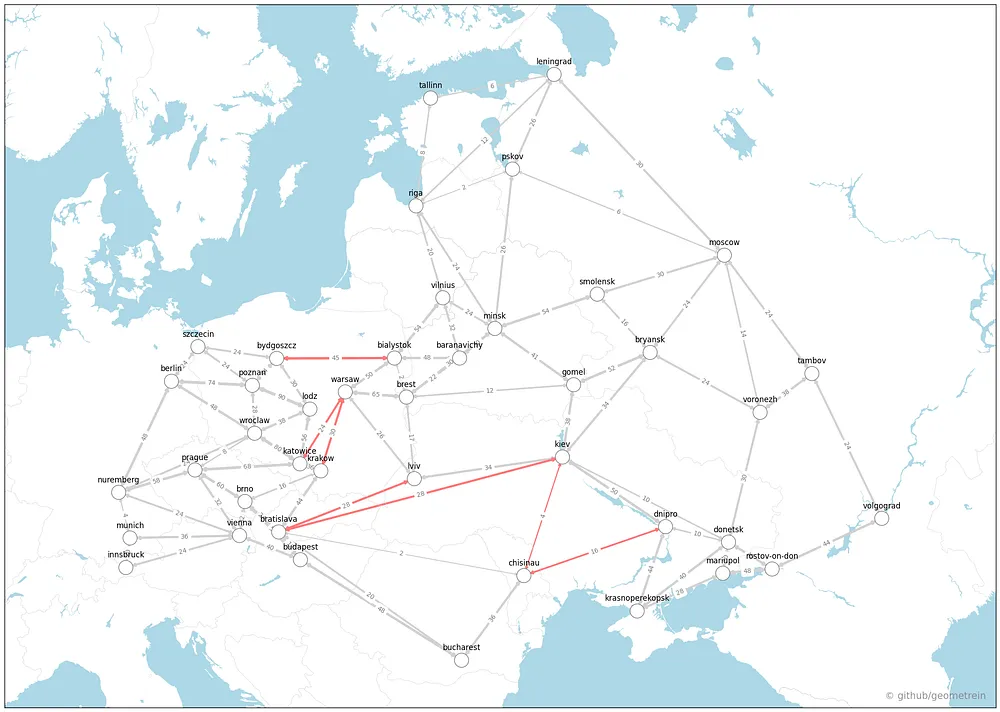
Minimal cut for Target: Kyiv Sink: Berlin. Image by the Author
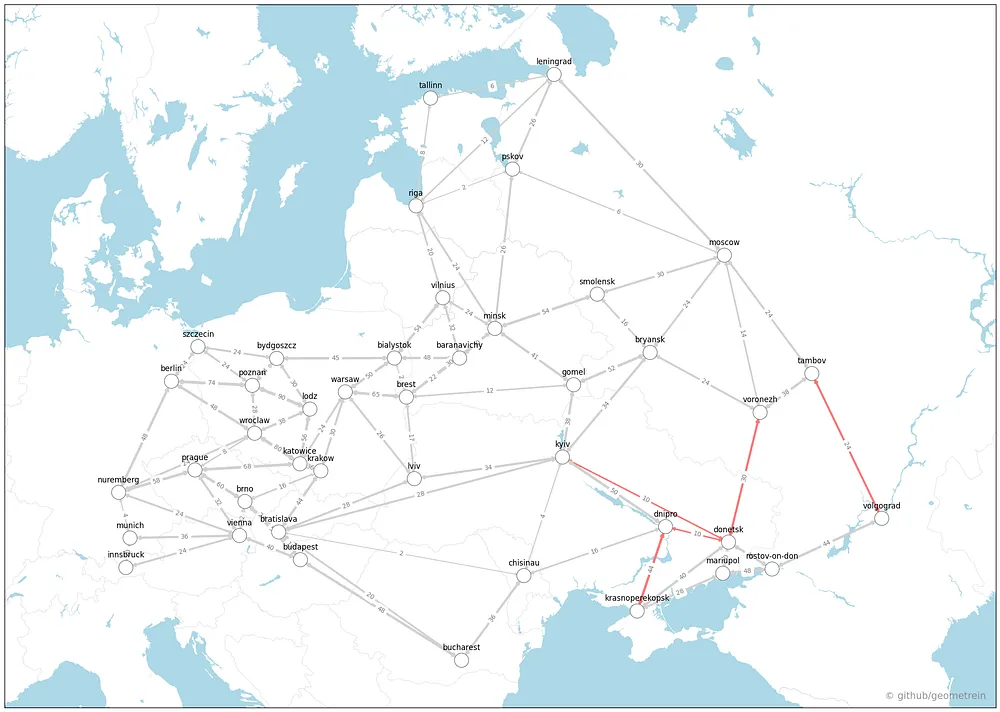
Right: Minimal cut for Target Moscow Sink Donetsk. Image by the Author
The charts highlight the links that serve as the minimal cut between the selected target and sink nodes. These would serve as the optimal airstrike targets to incapacitate the cargo transfer capacity between the two selected nodes. We can iterate over all nodes in the network and visualize the min cuts for each of the node pairs. The animation below illustrates how minimal cuts would look when the target node is Berlin and the sink node is randomly selected from the network.

Image by the Author
In these visualizations, the Max Flow Min Cut algorithm demonstrates its effectiveness in identifying the critical points of failure within a network. By targeting these minimal-cut links, the cargo transfer capacity between Berlin and any other node can be fully disrupted, highlighting potential vulnerabilities. The algorithm is particularly powerful because it provides a clear, quantifiable measure of the network’s resilience and the potential impact of targeted disruptions. What the Harris-Ross method does differently is that it takes into account the capacity of the rest of the network to compensate for the lost links and this allows for more accurate modelling. This consideration of network redundancy and the ability to reroute flows makes the Harris-Ross method more robust for practical applications where network elements may be designed to adapt to losses.
Conclusion
While the US Air Force never really used the method against the USSR, the algorithm saw many improvements over time. Its modern and more complex variants are used today to manage traffic flows and prevent bottlenecks. They are crucial for identifying points that could lead to cascading failures in power grids. Businesses leverage these methods for decision-making and understanding the critical points in their supply chains and operational networks. Social media networks, use these methods to analyze and optimize the flow of information.
Moreover, in the realm of computer vision, improved versions of these algorithms are employed in image segmentation tasks, allowing for efficient and effective image processing.
Overall, the evolution of the Max Flow Min Cut theorem and its derivatives highlights the importance of robust network analysis techniques in an ever-increasingly connected world. These methods not only provide insights into potential vulnerabilities but also offer strategies for enhancing the resilience and efficiency of complex systems across various domains
The code
You can find all the code used for the article in this repo:
networks/projects/max_flow_min_cut_theorem at main · Geometrein/networks
Data Sources
All the data used for the article can be found here:
networks/projects/max_flow_min_cut_theorem/data at main · Geometrein/networks
References
- T.E. Harris, F.S. Ross: Harris-Ross fundamentals-of-evaluating-rail-net-capacities
- G. Dantzig, D. R. Fulkerson: On the max flow min cut theorem of networks