The Deadly Silk Road: Global Arms Trade as a Network
Over 10,000 arms transfer deals from 2000-2023, mapped as a spatio-temporal network to trace who supplies the world's missiles and how that has shifted.
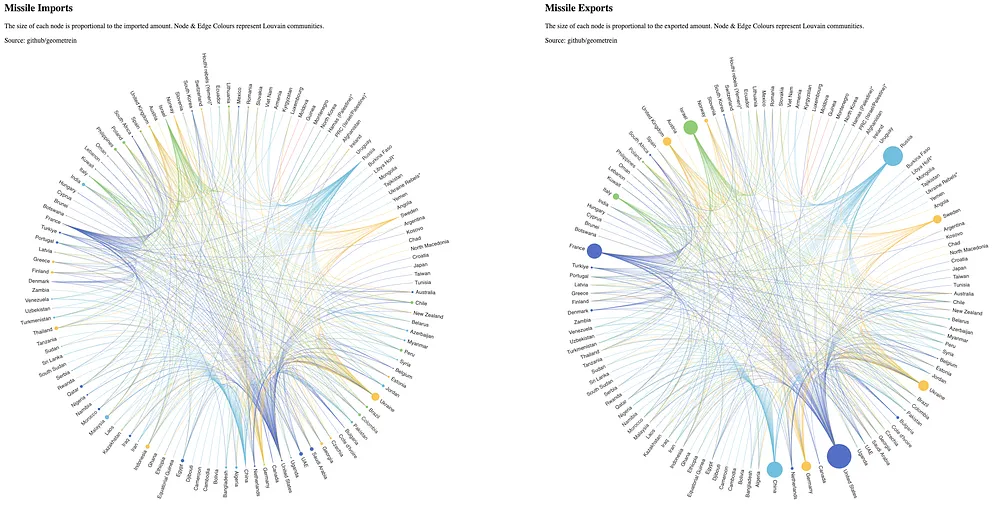
Chord Diagram of Global Arms Transfers. Image by the Author. © github/geometrein
Introduction
In the last article, we discussed how the CIA utilized network science for the war effort. In this article, we will look into the logistical Silk Roads that fuel modern conflicts with a fresh supply of arms worldwide. The dataset explored here includes more than 10.000 arms transfer deals made worldwide between 2000–2023. It contains valuable insights into the flow of arms across countries, the types of weapons traded, and the major players in the global arms market.
The chart below illustrates the number of trade deals made for each weapon category between 2000 and 2023 by all countries, organizations and military alliances worldwide.
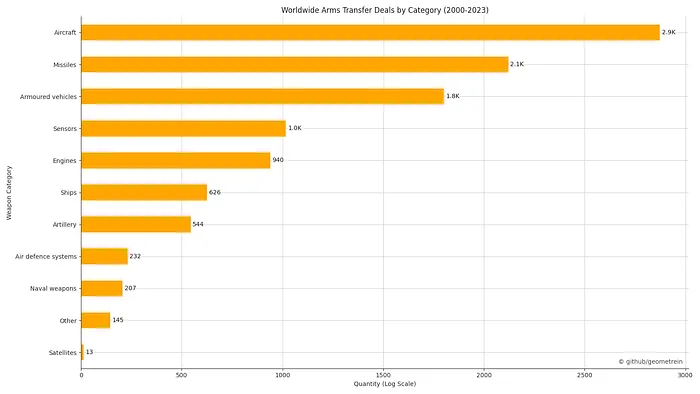
Image by the Author. © github/geometrein
Aircraft deals clearly lead the category with the highest quantity of deals, followed by missiles and armoured vehicles. The dominance of aircraft and missiles suggests an emphasis on enhancing air dominance and long-range strike potential typical for modern warfare. However, this representation might be misleading since aircraft deals typically include a few aircraft while missile deals include several thousands of missiles. Let’s visualize the number of units transferred in each deal instead.
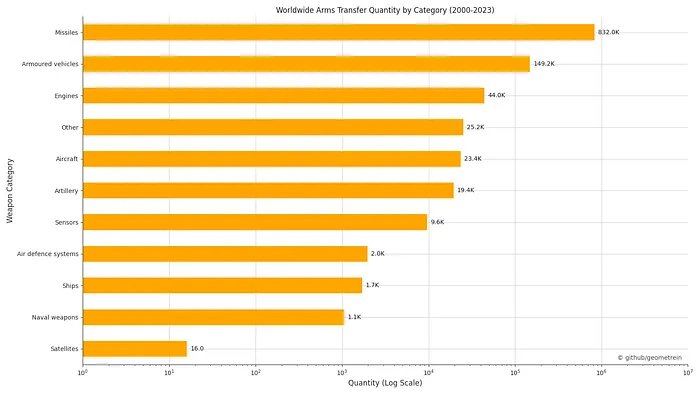
Image by the Author. © github/geometrein
As suspected missiles dominate the arms transfers while the aircraft transfers fall back to 5th place (mind the logarithmic scale). Since missiles are the main weapon of modern wars and the core part of our dataset we can focus on missile transfers and eliminate the complexity introduced by multimodality of the trade.
Missile Transfers
Which countries are the largest missile exporters?
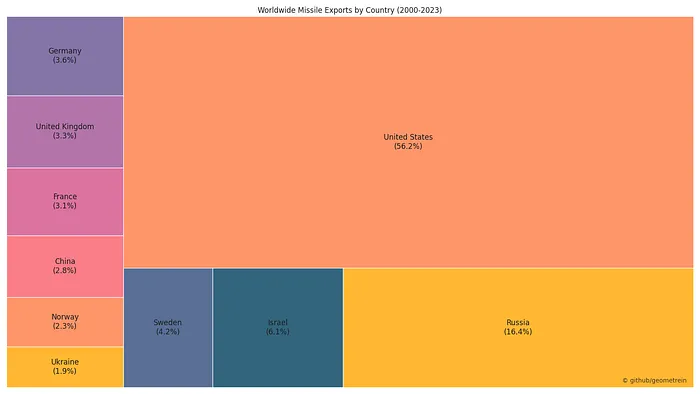
Image by the Author. © github/geometrein
The United States is the leading missile exporter by a large margin, followed by Russia, Israel, and Sweden. The chart reflects the dominance of the USA in the global arms market due to its advanced missile technology and extensive military-industrial complexes.
Which countries are the largest importers?
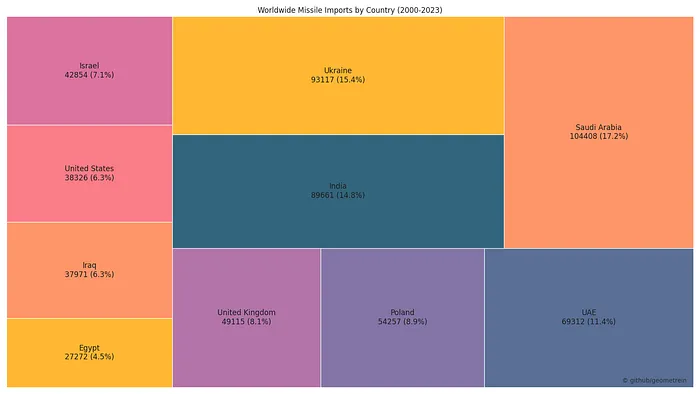
Image by the Author. © github/geometrein
Saudi Arabia leads as the top importer, followed by Ukraine, India, the UAE, and Poland. The quantities indicate a significant demand for missiles in these countries, likely reflecting regional security concerns, military modernization programs, or involvement in ongoing conflicts. This pattern of imports underscores the strategic priorities of these nations and their reliance on advanced missile technologies to bolster their defence capabilities. The high import levels in these regions highlight the geopolitical tensions and the emphasis on maintaining robust military arsenals.
Are there more missiles being transferred?
The chart below illustrates the volume of recorded Missile trades worldwide between 2000 and 2023.
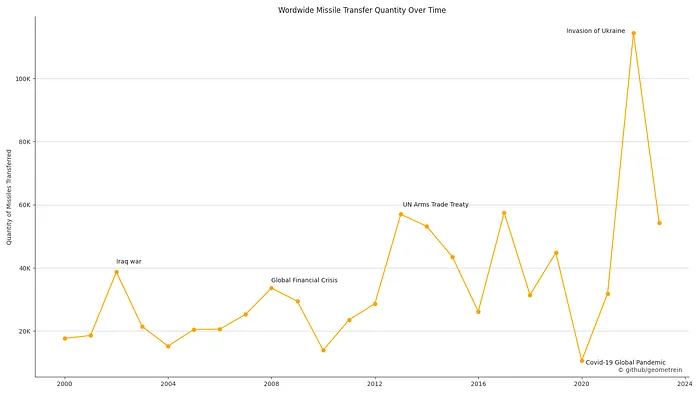
Image by the Author. © github/geometrein
There is a noticeable increase in missile exports around every major conflict escalation. Over the past two decades, the overall number of exported missiles has steadily risen, indicating a growing trend in global arms transfers. This trend reached an unprecedented spike with the invasion of Ukraine, highlighting the significant impact of geopolitical tensions on the arms trade. The sharp rise in missile exports during such critical events underscores the strategic importance of missile technology in modern warfare and the increasing reliance on these weapons by nations involved in conflicts.
Which missiles are sold the most?
Missiles are products, and naturally, some are more popular than others. The chart below illustrates the top product exports from each country over the past 23 years. This data highlights the varying demand and preference for different missile types across nations, reflecting the strategic priorities and technological advancements of each country. The chart offers a glimpse into the specific missile technologies that have dominated international trade over the past two decades.
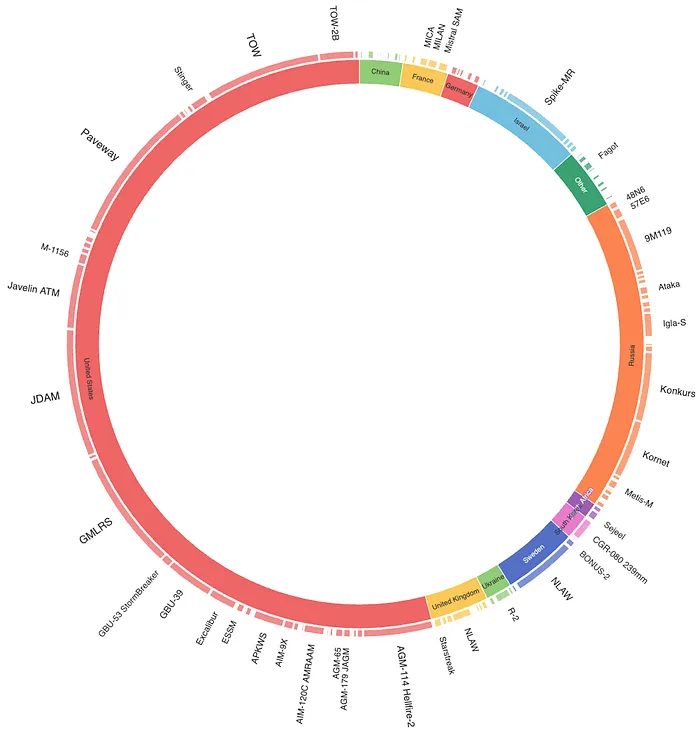
Sunburst chart of missile exporters. Image by the Author. © github/geometrein
Military Alliances
Arms transfers not only provide insight into trade dynamics but also serve as a proxy for understanding military alliances. Conflicting nations are less likely to engage in arms trade, opting instead for direct missile exchanges on the battlefield. Conversely, cooperating countries demonstrate their alliances by purchasing or supplying arms to each other. Based on this hypothesis, applying a community detection algorithm to our trade network should reveal military alliances established in the modern world.
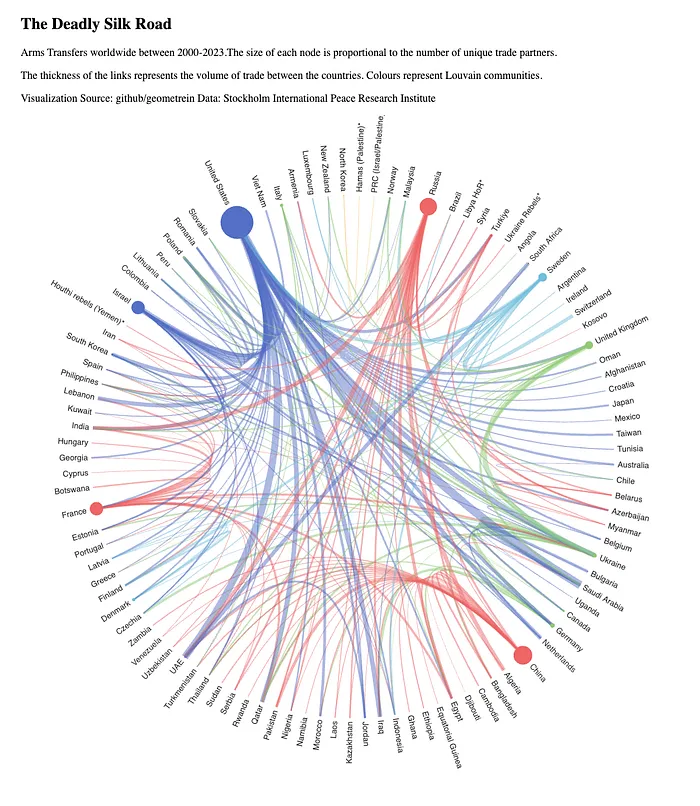
As expected there are two main camps. The United States, the UK, a large part of the EU and Israel form one community while Russia and China create their own. An interesting finding is that seems like France has been trading arms with the same countries that Russia and China normally trade with. Another interesting community can be seen between North Korea, Hamas and PRC likely an attempt by Kim Jong Un to side hassle and raise some cash.
We can visualize the arms trade relation network geographically to gain a comprehensive understanding of how trade dynamics have evolved over time. By examining these visualizations, we can identify patterns and trends in arms transactions. The animation below provides a dynamic illustration of the global arms trade network, highlighting key changes and developments in the industry. This visualization starkly illustrates how geopolitical events and escalating regional conflicts influence the flow of arms.

Image by the Author. © github/geometrein
There are several noteworthy timestamps in the animation that merit attention. For instance, it is noticeable how arms transfers to Ukraine skyrocketed following the Russian invasion. Ironically, the military operation that intended to demilitarize Ukraine has led to an unprecedented concentration of arms in the country. Additionally, it illustrates how the COVID-19 pandemic impacted civilian logistic infrastructure and military supply chains, affecting the dynamics of arms trade worldwide. The flow of arms also clearly illustrates how the state of mutually assured destruction has simply channelled the ongoing inter-species competition for resources between the larger states into proxy wars fought by third parties. The conflicts are shifted geographically but the main arms suppliers remain unchanged.
Code & Data
The underlying dataset has a lot more interesting relationships to explore that were not included in this article. The code behind the visualizations, cleaned and organized data and some extra visualizations can be found in this repo:
The cleaned data used for this article can be found here:
networks/projects/the_deadly_silk_road/data at main · Geometrein/networks
The final dataset was created based on SIPRI’s data. All the credit for meticulously recording and publishing the data goes to them.