Finnish Startup Ecosystem
A statistical look at Finland's startups in 2025: where they cluster, what they build, how they perform financially, and who leads them.
Intro
Innovation isn’t optional; it’s a structural necessity. As complex adaptive systems scale, they follow accelerating growth patterns punctuated by stagnation or collapse. Biological, social and economic systems all depend on timely shifts to reset their trajectory.
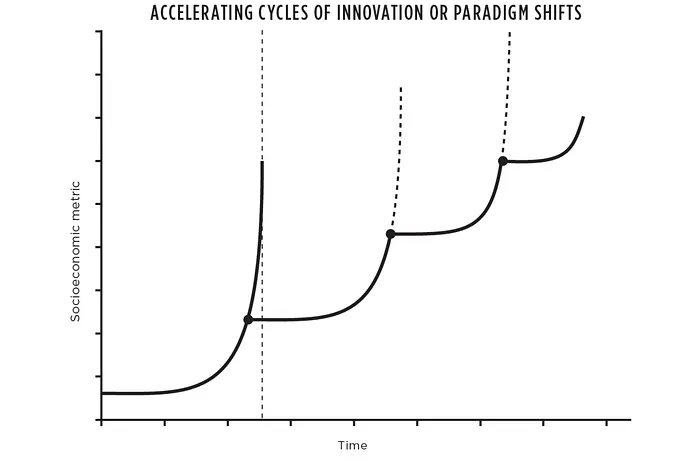
Graph of successive exponential growth trajectories, each potentially leading to a finite time singularity (denoted by the vertical dotted line) and subsequent collapse unless an innovation is made at a time prior to the singularity (denoted by the black dots), which resets the clock to start the entire cycle over again. From: Geoffrey West: Scale: The Universal Laws of Growth, Innovation, Sustainability, and the Pace of Life in Organisms, Cities, Economies, and Companies
The economy is one such system: a vast network of agents exchanging capital, labor, information and attention, constantly adapting to shifting incentives and constraints. When the dominant logic of production or consumption begins to ossify, it is often not the incumbents but peripheral actors, experiments at the edge, that drive the next wave of change. This is where startups come in. Lean, adaptive and free of legacy processes, startups are well placed to explore uncertain frontiers. They are probes into the future, testing new models, technologies and behaviors that can unlock the next growth trajectory.
Venture capital and startup financials are both signals: VC reflects expectations, while financial performance shows validation. The chart below tracks global VC funding by industry from 2000 to 2025.
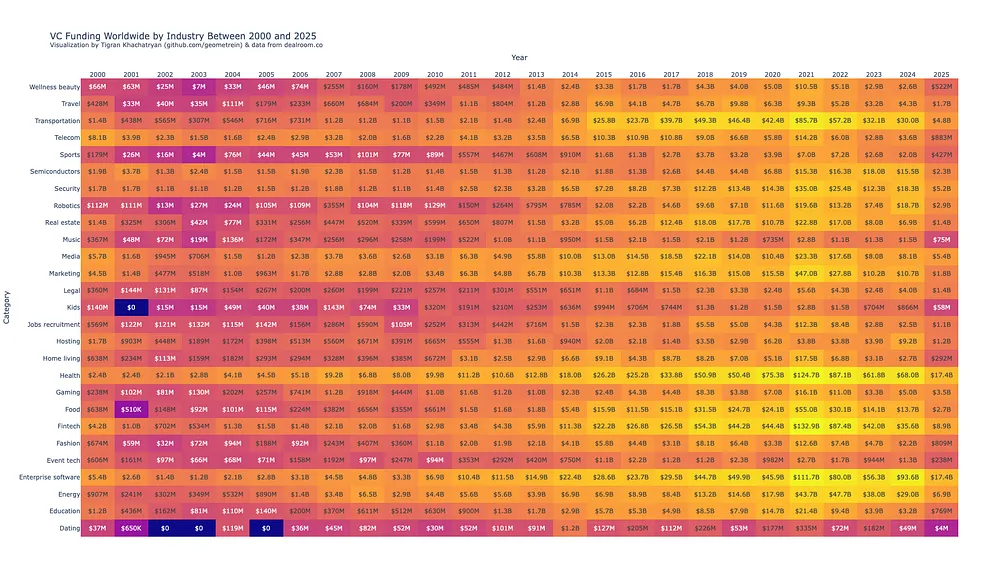
VC Funding Worldwide by Industry Between 2000 and 2025.
Over the past several years, funding has grown both in volume and in sectoral spread. Fintech, healthtech, enterprise software and energy have seen massive surges, often in response to breakthroughs or systemic stressors that exposed the limits of existing paradigms. This mirrors the cycles of disruption and renewal described in complex systems theory. When dominant industries begin to stagnate, capital moves to the periphery in search of the next structural reset, and startups are the vehicle through which these resets happen.
However, venture capital is also prone to hype cycles, where funding runs ahead of substance and follows narratives rather than outcomes. To understand what actually delivers value, we need to look past expectations to validation: startup financial performance. It shows which innovations hold up in practice.
In this article, we analyze a sample of 757 Finnish startups listed on the startup100 page. The startup100 data is enriched with financial information by matching business IDs to publicly available financial reports.
Startups: Spatial Distribution
Let’s begin with where startups are located across Finland.
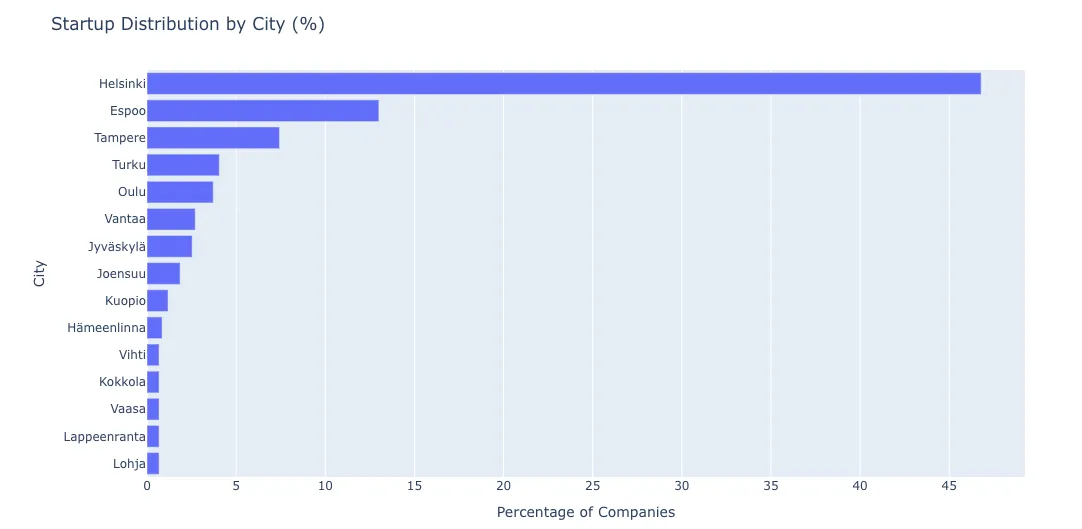
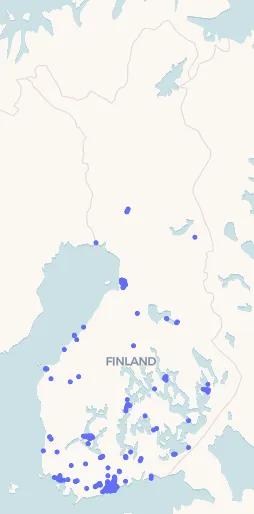
Startup formation is highly centralized: over 62% of companies are based in the Helsinki Metropolitan Area (Helsinki, Espoo, Vantaa). This follows a pattern seen in innovation ecosystems around the world, where proximity to talent, funding, infrastructure and community drives concentration. Beyond the capital region, Tampere is the leading hub, while Turku, Oulu and Jyväskylä have smaller but notable clusters of activity.
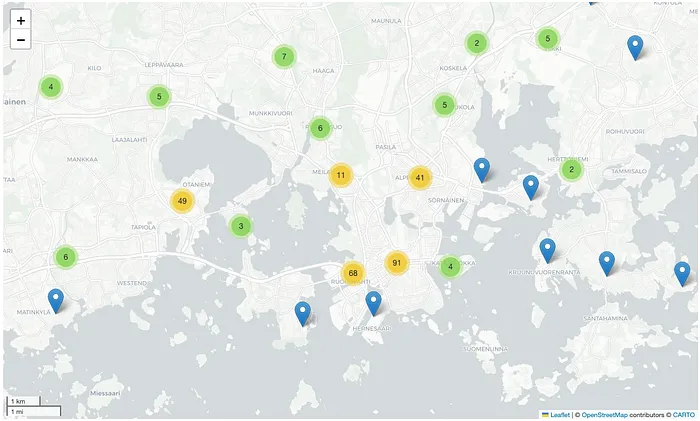
Within the Helsinki Metropolitan Area, startup activity is concentrated around three hubs: Helsinki city centre, the Maria 01 startup campus and the Aalto University campus.
Startups: Business Domain
Next, let’s look at the business domains in which startups operate.
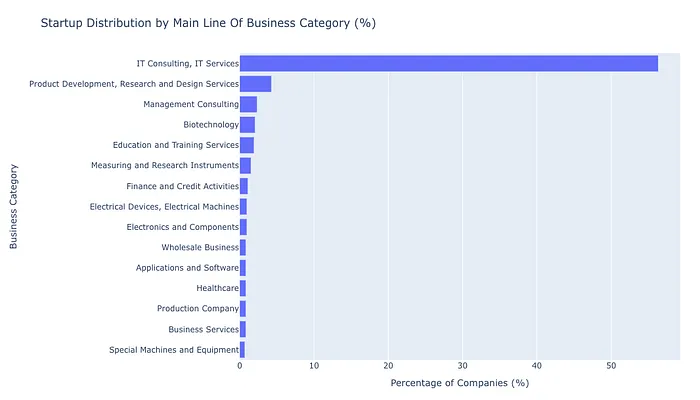
IT Consulting and IT Services account for over 56% of all startups in the dataset, so the Finnish startup ecosystem is heavily skewed toward digital services, in line with global trends in tech-driven entrepreneurship. The second-largest category, Product Development, Research and Design, accounts for less than 5%, a steep drop beyond IT. Finland has a vibrant digital services sector, but diversification into deep tech, hardware and industrial innovation remains limited.
Zooming in on the IT category shows a clear skew toward software.
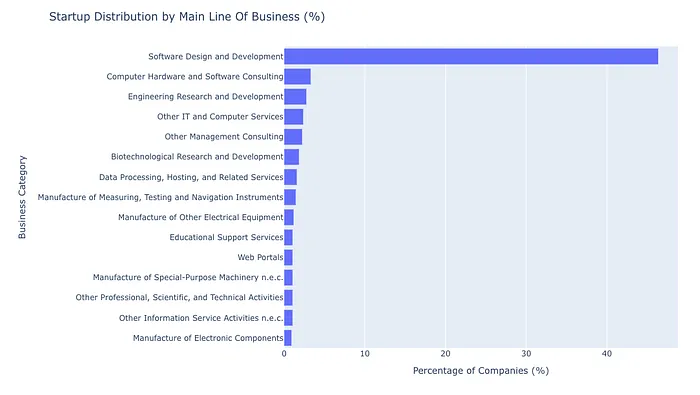
Nearly half of all companies (over 46%) fall under Software Design and Development, the single most common business line among Finnish startups. Other tech-adjacent areas like Computer Hardware and Software Consulting and Engineering R&D each represent only around 3%. In other words, Finland’s startup ecosystem is software-first. That reflects global patterns, but it also raises questions about diversification into hardware, biotech and industrial tech, sectors with longer development cycles but potentially greater structural impact.
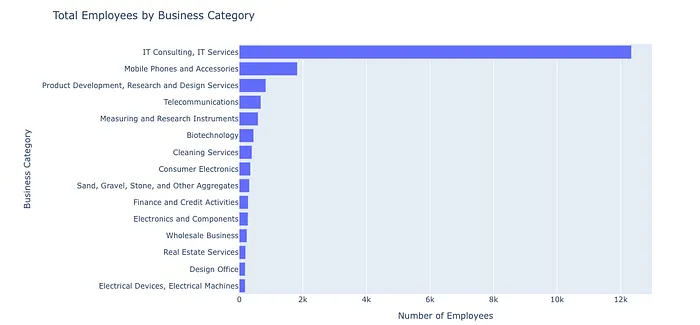
Employment tells the same story. IT Consulting and IT Services employ over 12,000 people, far ahead of the next category, Mobile Phones and Accessories, with fewer than 2,000 employees. Interestingly, Cleaning Services and Construction Aggregates also make the list, so alongside the tech-centric narrative there is still demand-driven entrepreneurship in more traditional, service-heavy sectors. IT is both the most common domain for new startups and their biggest source of jobs.
Startups: Financial Performance
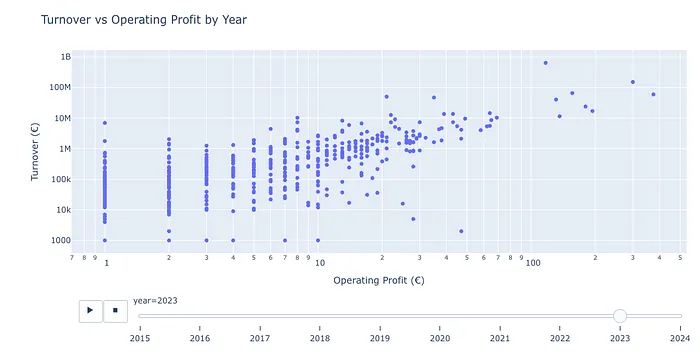
Note: The log scale excludes negative values, so loss-making companies are not visible in the chart.
The scatter plot shows a clear positive correlation: as revenue increases, profitability tends to follow, especially among higher-revenue firms. Most startups cluster in the low-turnover, low-profit zone, as expected for early-stage or niche ventures that are still building scale. A handful of outliers combine high turnover with profitability, likely mature or fast-scaling companies that have moved from experimentation to execution. The logarithmic axes also show how widely financial performance varies, from micro-startups generating thousands of euros to scale-ups approaching €1B.
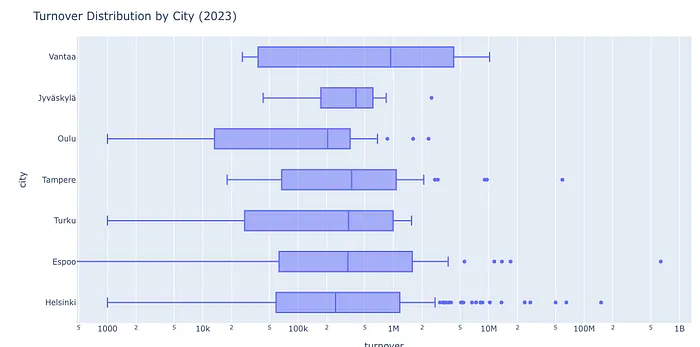
Broken down by city, the Helsinki Metropolitan Area (particularly Helsinki and Espoo) leads in both scale and spread. These cities have the widest turnover ranges and the most outliers, including startups with more than €100M in annual revenue, which makes them the financial anchors of Finland’s startup economy. Tampere, Turku and Oulu have more balanced but modest profiles. The logarithmic scale again shows a basic fact of startup economies: most companies create modest value, while a few account for an outsized share of the total.
Median Financials Over Time
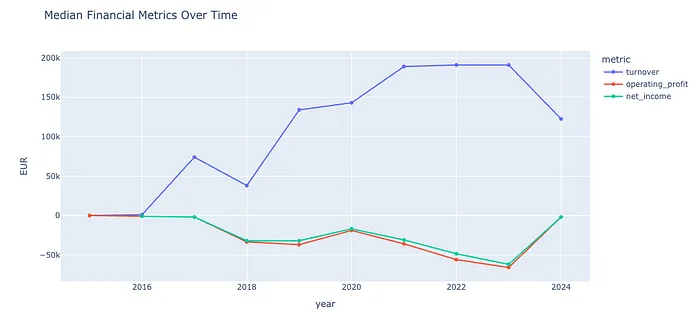
Over time, median financials show a clear tension between revenue growth and profitability. Median turnover rose sharply from 2017 and peaked between 2021 and 2023 at nearly €191K, before dipping in 2024, likely because reporting for that year is incomplete. Despite this growth, median operating profit and net income have remained negative since 2018. The lowest point came in 2023, when median net income fell below –€60K, which suggests rising operating costs or burn. The slight uptick in 2024 is probably skewed by early data. Overall, revenue across the ecosystem is scaling, but the typical startup still struggles to turn growth into profit.
Financial Ratios
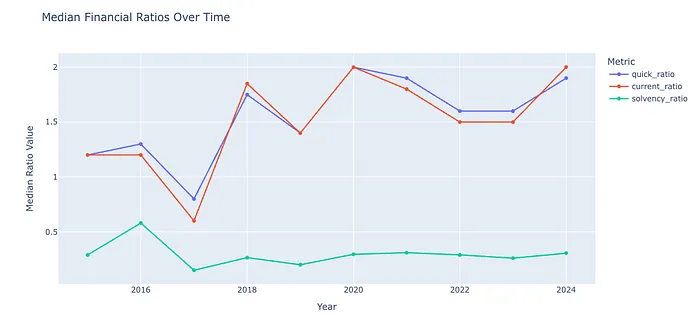
Financial ratios give a view of the structural health of Finnish startups. Liquidity, measured by both the quick and current ratios, has stayed above 1.0, which means the median startup can cover its short-term liabilities with its assets. A spike to nearly 2.0 in 2020 likely reflects cash hoarding during COVID. Solvency is a different story: the median solvency ratio has stayed below 0.3, pointing to heavy reliance on external capital and thin equity buffers. With strong liquidity and weak solvency, startups can generally manage day-to-day operations but lack long-term financial independence, and they remain dependent on venture funding and other external financing to grow.
Turnover per employee
Turnover per employee shows how operational efficiency changes with company size.
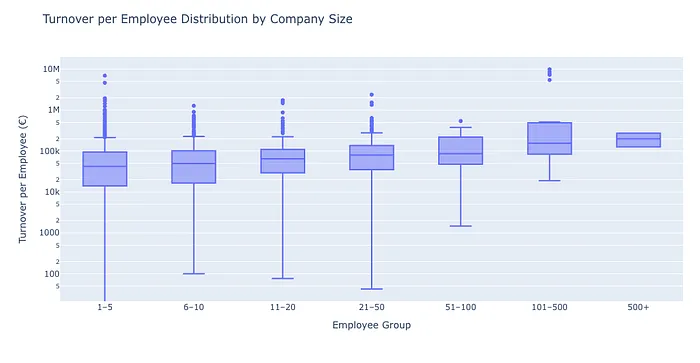
As companies grow, median turnover per employee improves, peaking in the 101–500 employee range. Scaling seems to bring efficiency gains, likely from better resource allocation, specialization and process maturity. The 500+ group shows a slight drop, which may point to efficiency plateauing or growing organizational overhead in the largest firms. Small companies (1–50 employees) vary the most: some, often SaaS or IP-driven businesses, generate high turnover per head, while others have minimal revenue. Growth can unlock productivity, but scale doesn’t guarantee efficiency, especially at the top end.
Financials Across Sectors
Looking at 2023, the year with the most available data, shows how financial performance varies across sectors.
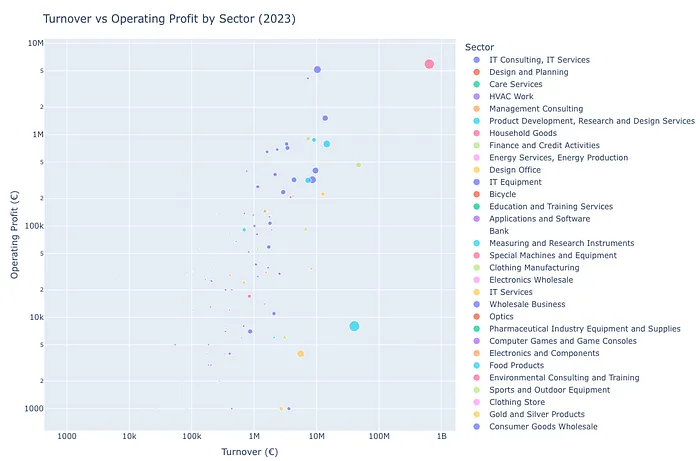
There is a strong positive correlation between turnover and operating profit, especially among companies with higher revenues. IT Consulting, Product Development and Finance dominate the upper-right corner, with firms earning over €1M in operating profit and turnover approaching €1B. Applications and Software startups mostly fall in the mid-turnover range, yet many still post healthy margins. Bubble size shows employee count: larger firms tend to have higher revenue and profit, but not uniformly, and some small teams earn far more than their size would suggest. Outcomes range widely, from micro-scale experiments to companies leading their sectors.
Top Companies
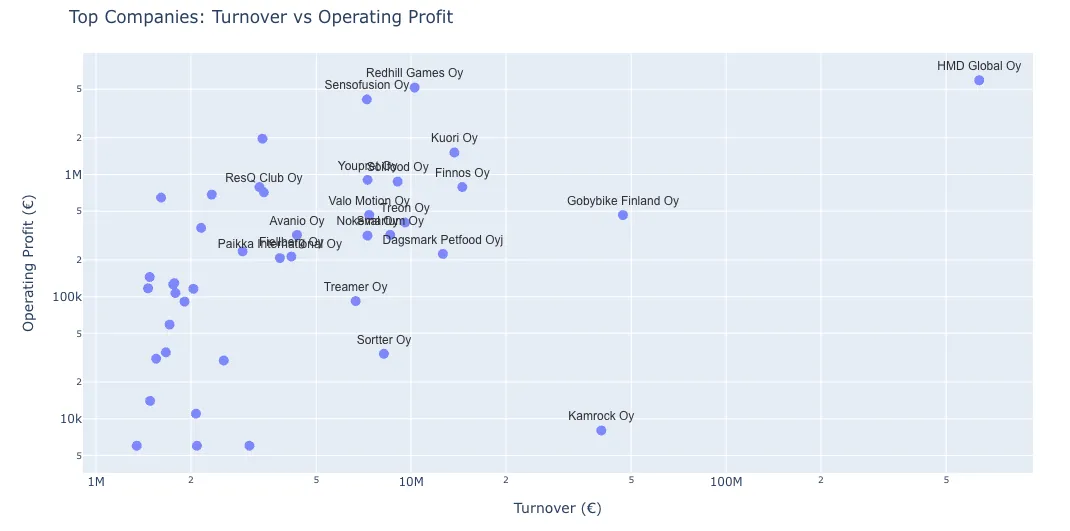
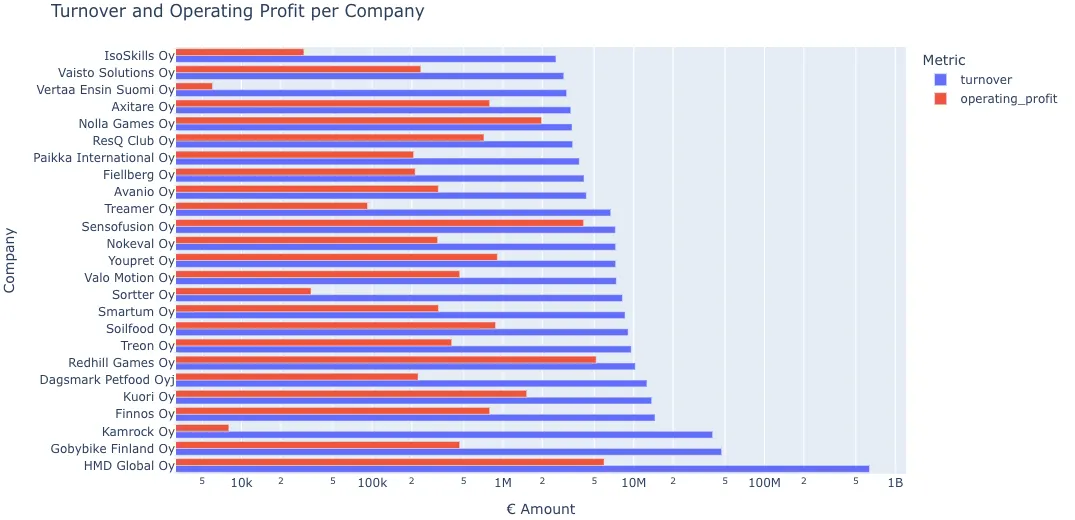
Among Finland’s top-performing startups, the top 20% by turnover and operating profit, there are several distinct paths to success. At one extreme, HMD Global Oy leads in both scale and profitability, with over €500M in turnover and multi-million euro profits. It is a clear outlier and a benchmark for large-scale success in Finland.
Several companies succeed through efficiency rather than volume. Redhill Games Oy, Sensofusion Oy and Youpret Oy have exceptionally strong profit margins on more modest revenue, which suggests lean operations, high-value offerings, or both. Profitability doesn’t require massive scale.
Others, like Kamrock Oy, Sorter Oy and Vertaa Ensin Suomi Oy, fall into a different category: high revenue but low profitability, likely because of thin margins or heavy cost structures. Growth without operational efficiency can be a liability.
A third group, ResQ Club Oy, Smartum Oy and Gobybike Finland Oy, balances revenue and profitability well. Their businesses often center on sustainability, employee benefits or social responsibility, values that resonate with Finnish consumers.
Startups: Leadership Network
Finally, let’s look at who makes the decisions in Finnish startups.
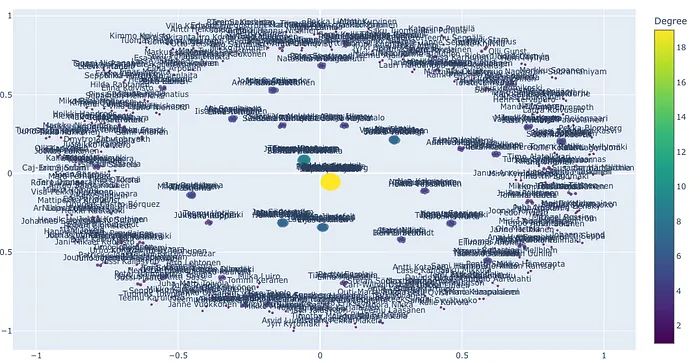
The graph above shows the network of decision-makers across Finnish startups. Each node is a person, and two people are connected if they are both listed as decision-makers in the same company.
The leadership network is fragmented, with pockets of connectivity. Most decision-makers appear alone or in pairs: over 150 groups consist of exactly two people, typically co-founders or small single-company boards.
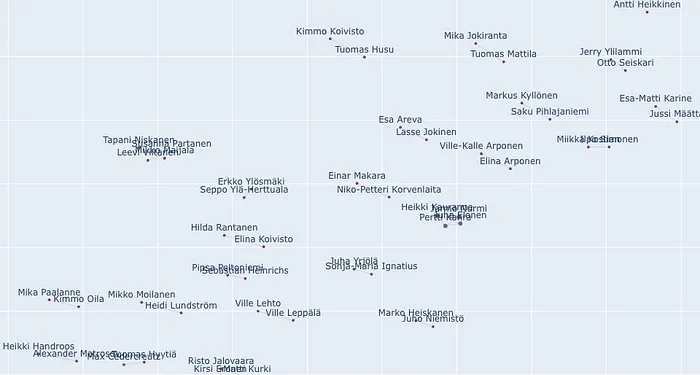
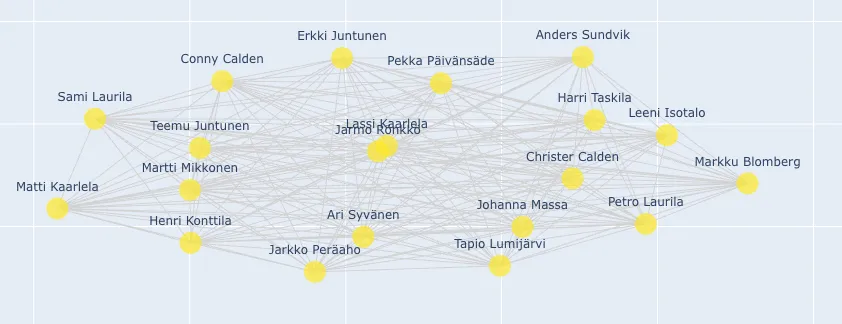
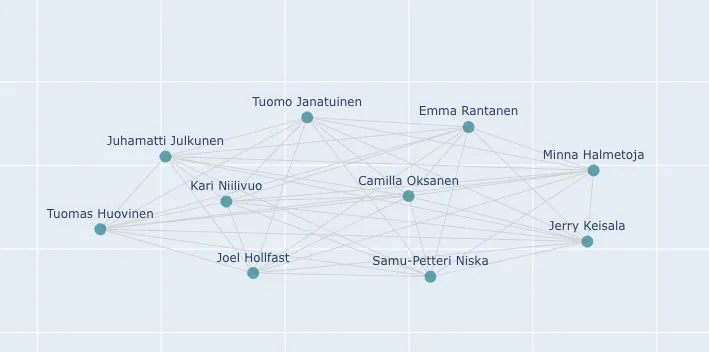
The larger, highly interconnected clusters mostly reflect companies with bigger leadership boards.
A closer look at the topology, however, reveals a small number of dense clusters where individuals hold roles in several companies. These high-degree nodes are the ecosystem’s connectors: serial entrepreneurs, investors and board professionals who bridge otherwise separate startups. Though rare, they play a disproportionate role in spreading knowledge and strategic thinking across ventures. The network is heavy-tailed: most governance ties are isolated, while a few people influence several companies at once.
Conclusion
The Finnish startup ecosystem combines focused specialization with distributed experimentation. It is geographically centralized in the Helsinki Metropolitan Area, with dense clusters around Maria 01, Aalto University and the city centre, but diverse in how companies are organized. Its most successful startups follow different models: some win on scale, others on efficiency or values.
By sector, the ecosystem is dominated by IT and software, in both company count and employment, reflecting global demand for digital solutions and Finland’s technical talent base.
Financially, revenue is growing but profitability remains a persistent challenge. Most startups operate with modest turnover and negative margins, and outcomes range from micro-startups to multi-million-euro scale-ups. Liquidity is strong, but solvency is weak, reflecting dependence on external capital and the early stage of many firms.
On the people side, the leadership network is fragmented, with a few key connectors. Most decision-makers stay within a single company, while a small number link startups together and spread knowledge across the system.
Taken together, Finland’s startup ecosystem is lean, digitally focused and maturing. Its strengths are technical depth, talent density and a growing base of operationally sound companies. To become a more self-sustaining innovation economy, the next steps are broader diversification beyond software, stronger financial independence and more leadership connections between ventures.
Sources
The code & the data:
GitHub - Geometrein/startups: This project explores the Finnish startup ecosystem.
The interactive visualizations:
Other sources: